In this section, we explain how we went about collecting all of the data in the dataset. The Marron Institute’s Transit Costs Project gives us unit construction costs for projects expressed in US dollars, which facilitates comparison between countries. Our goal was to find out the construction costs of historical projects and then convert them into present-day US dollars, doing the methodology used below.
Luckily for our purposes, the construction of any large infrastructure project in a country with representative government and systems of parliamentary oversight generates large numbers of public documents, such as annual reports. For instance, the construction of the world’s first subway in London in 1863 was extensively covered in the press and was discussed in lengthy government documents that were crammed with numbers and presented to parliament. For instance, we can determine the construction costs per mile of all underground lines in the UK by accessing data in the parliamentary command papers, data-rich documents that civil servants submitted to parliamentary committees each year and which have recently been digitized in a keyword searchable form. I have used tabular data in such documents in previous research projects.
Similarly source of data for other Western countries exist and have, in many cases, been digitised. For instance, the costs associated with building the first Paris Metro lines in the late 1890s can be determined from the reports that engineer Fulgence Bienvenüe submitted to the Parisian authorities (Galviz, 2019). Comprehensive lists of every underground line ever constructed have been developed by popular and academic historians. We used these lists, along with some cross-checking of digitised primary sources to construct a database that records various constructions cost all underground lines built in the 19th and 20th centuries.
Here’s an example of how we went about finding out about unit construction costs in historical projects. The world’s first subway project, the future Circle Line of the London underground, was approved in 1855. Actual construction began in March 1860 and the system was finished in January 1863. The line was 6km in length, 100% underground, constructed using the cut and cover method, and cost £ 1,250,000 to build in 1863 British pounds. There are different ways of converting historical monetary values into present-day ones, but for this type of calculation, it is best to use the GDP deflater, since that gives you to the cost of the economy of doing a big public project with a high social rate of return, such as building a subway to ease congestion in your capital city, putting a man on the moon, or vaccinating all of the kids in your country against polio. So we converted 1863 British money into modern British currency using the GDP deflator and then, to facilitate international comparison, we converted the value in pounds to US dollars at the Purchasing Power Parity rate (think of the Big Mac Index). For a variety of reasons we can’t get into here, using Purchasing Power Parity exchange rates is appropriate here.
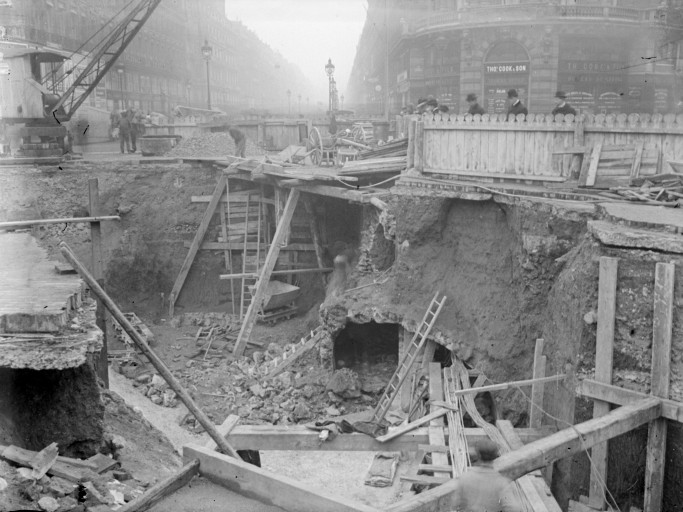
Image Above: Recueil de pièces, Construction du métro, Paris 1902-1910, [Image fixe numérisée] / Jules Girard, photogr. Publication : [Saint-Cyr] : [Direction du patrimoine. Archives du patrimoine photographique], [1902-1910] Source: Gallica Database 03300288. Public Domain Image Under French Copyright Law.
Having first compiled a database and estimated costs, we then engaged in the more complicated task of trying to formulate causal explanations for the patterns we observe. We used the technique of breakpoint analysis, which is commonly used in economic-historical research project, and which involved focusing on the periods in which we observe the beginnings of construction cost divergence between groups of countries.
Readers will observe that we have 86 different subway projects in our dataset. The oldest is the aforementioned 1863 London project. We also have completed data for most the projects built during the flurry of subway projects built around the turn of the twentieth century, when Budapest, Glasgow, Boston, and then Paris acquired subway systems and London’s was expanded. (Despite our best efforts and those of our multilingual research assistants, we were simply to get information about the construction costs of the Budapast metro, which opened in May 1896 and was operated by the Franz Joseph Underground Electric Railway Company. We also got data for the German lines built in the early twentieth century, when Hamburg (1902) and Berlin (1912) developed their systems. New York City’s subway began carrying paying passengers in 1904 while Philadelphia’s subway system opened to the public in 1907. During the First World War, combatant countries stopped building lines, although New York’s system continued to expand (with contemporaries complaining about the effects of the European war on construction costs) and Madrid acquiring a metro system in 1919. We also acquired data about the lines built in the interwar period in Paris, New York, and Berlin. We got information about the small subway constructed in Chicago but were unable to determine the costs of the Cincinnati subway system, the partially completed system that was abandoned before any trains went into service. After 1945, there were relatively few subways constructed in the US, as Americans shifted to commuting by car. However, there were new systems built in Toronto (1950s) and Montreal (1960s) and we got construction cost data about them. We also got construction cost data about some, but not all, of the subway project built in the United States during and after the Great Society period, the era associated with President Lyndon Johnson’s desire to pour public money into social housing, public transportation, and the like. Somewhat curiously, it is hard to get reliable construction cost data about some of these projects, which is itself telling, but we were able to calculate the unit construction costs of BART (the Bay Area Rapid Transit system) as well as some of the post-war European subway projects, such as the Munich subway opened in 1971.
The construction costs of almost all the underground public transport projects built after about 1990 are included in the database of transit costs that has been compiled by the Marron Institute at New York University. We didn’t see any need to duplicate that research, which covers a vast number of cities. Since 2000, the number of cities worldwide with subways has mushroomed. As of May 2023, 194 cities in 62 countries have underground rapid transit systems that count as subways.
We did not wish to duplicate this database, so our aim in creating our database was to focus on earlier projects. The projects in our dataset include those built during the first golden age of subway construction (the period from the 1890s to about 1930 when cities on both sides of the Atlantic emulated London in constructing subways) and then some of the projects created in the second global wave of subway construction. In the middle decades of the twentieth century, relatively few new subway lines were built, partly due to the war’s devasting impact on Europe and the shift in emphasis in North America from public transport to designing cities around the car. (Ridership on the New York City subway peaked in the mid-1940s and then fell steadily as people moved to the suburbs and bought cars). The backlash against car culture and the obsessive building of freeways that began in the 1960s contributed to a renaissance in subway construction that saw many cities in Europe and the US acquiring their first subways—the Bay Area’s BART project was one of the best-known projects of that era. We found and included cost data for many of the “second wave” projects.
You will notice that some well-known historical subway projects, such as the Moscow Metro, aren’t in our dataset. Our overall goal in doing this research is to help capitalist democratic countries to figure out ways of building subways more cheaply. That means that we confined our research to historical subway projects in countries whose economies were monetized and in which money was meaningful. For that reason, any monetary values of projects completed in non-market command economies in prices were less meaningful than in the liberal democracies in which the costs of factors such as labour and capital goods are negotiated in a market economy and in which landowners are paid compensation that at market rates when their property is expropriated for subway construction. About the Moscow Metro: we didn’t both trying to search for the cost of building this line in Soviet roubles because we knew from secondary sources (Robbins, 1997). that this project was constructed using unpaid labour and in a socio-economic and political context that is radically different from the liberal democratic institutional environments that are the primary interest of the scholars and policymakers who are today interested in why the unit construction costs are higher in English-speaking liberal democracies than in liberal democracies in Western Europe and East Asia. It is notorious that the Soviet Union under Stalin used slave labour (that’s why it is was able to export so much Ukrainian wheat in the early 1930s). When you don’t have to pay workers market rates or pay for the land seized to build subway stations, the constructions cost can be amazingly low.
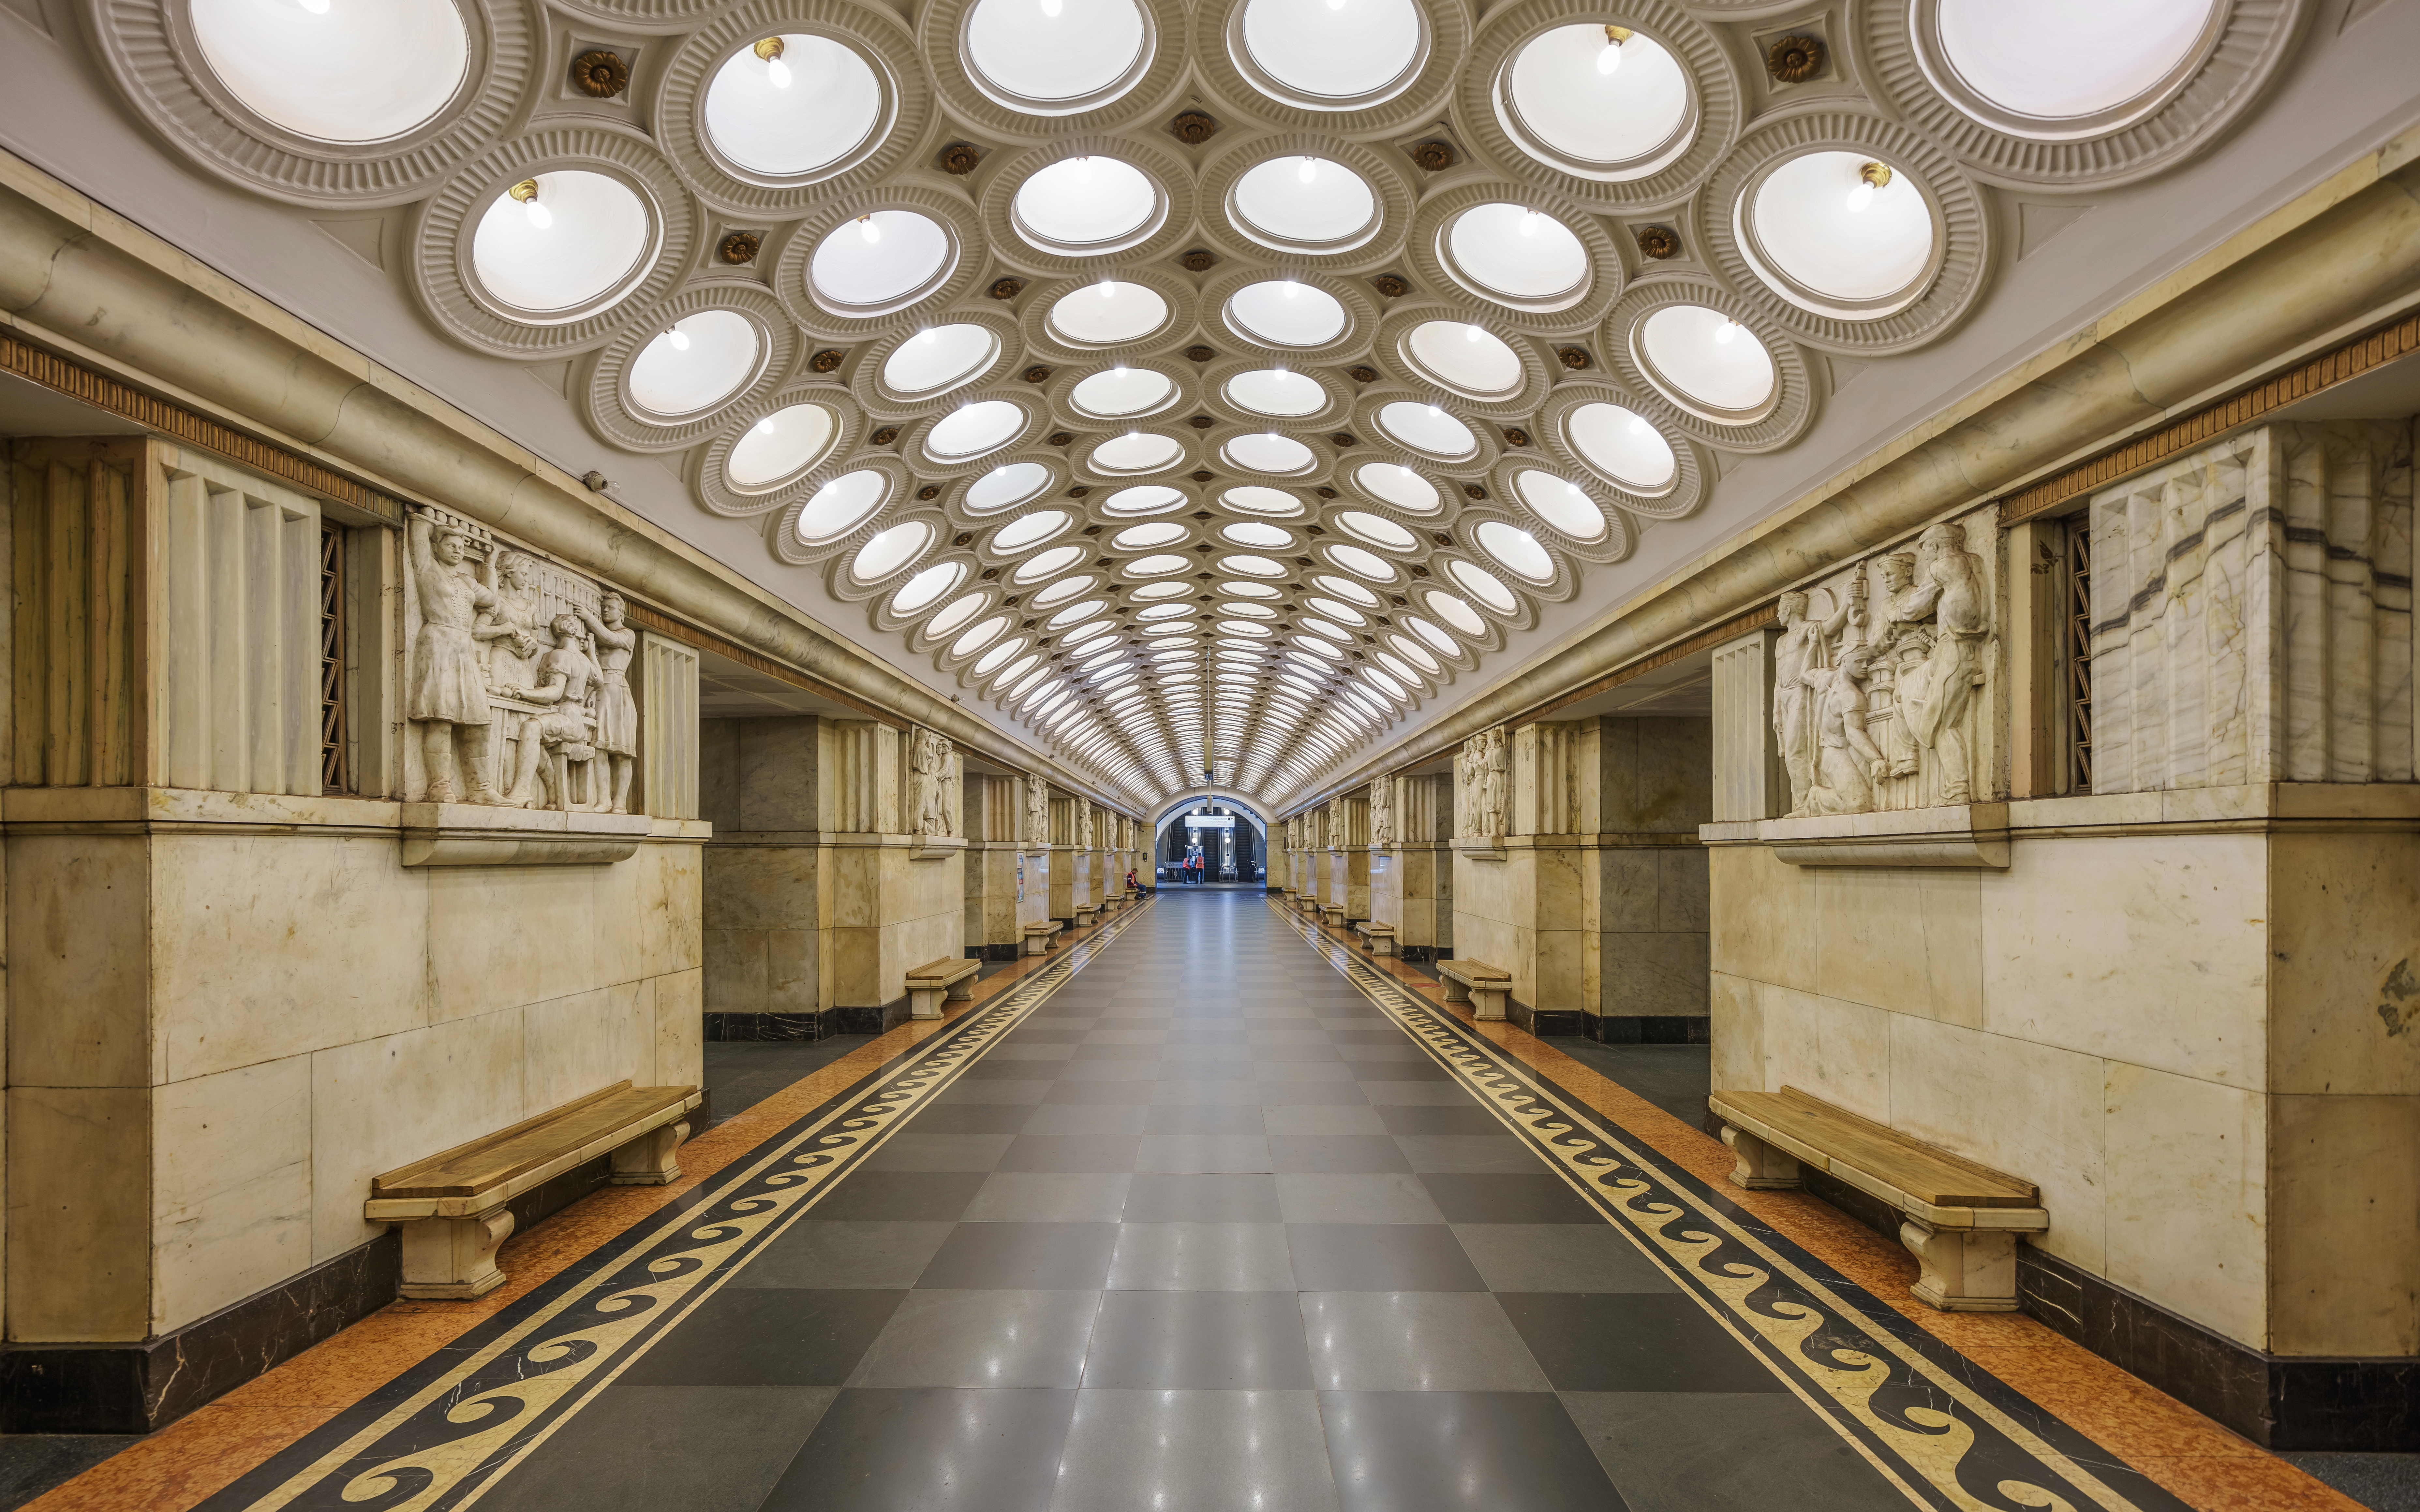
https://commons.wikimedia.org/wiki/File:Moscow_Elektrozavodskaya_metro_station_asv2018-09.jpg
We also didn’t include the early East Asian subways. Today, the developed countries of north-eastern Asia are at roughly the same level of economic development as Western Europe. GDP per capita is roughly equivalent. They also have political and economic institution (secure property rights, competitive labour markets, unions) that you find in Western countries. You might, therefore, be wondering why we didn’t include the earliest East Asian subway lines in our dataset. Tokyo opened it first subway line to paying passengers in 1927 and then constructed some additional lines. (In 1941, Japan’s military dictatorship nationalised these lines). Osaka got a subway in the early 1930s. Seoul’s first line opened in 1974. So why aren’t these lines in our dataset? The answer was that we concluded that a comparison of construction costs between these countries and Western countries wouldn’t be very meaningful because these countries were at a very different level of economic development at the time they started building subways—labour, the costs of buildings, what counts as a permanent building, etc, were all very different, as were the political and legal systems.
Table 1. [1] Subway and Metro Systems in the Western Countries 1863-1990
| City | Year |
| London | 1863 |
| Budapest | 1896 |
| Glasgow | 1897 |
| Boston | 1897 |
| Chicago | 1897 |
| Paris | 1900 |
| Berlin | 1902 |
| New York | 1904 |
| Athens | 1904 |
| Philadelphia | 1907 |
| Hamburg | 1912 |
| Buenos Aires | 1913 |
| Madrid | 1919 |
| Barcelona | 1924 |
| Stockholm | 1950 |
| Toronto | 1954 |
| Rome | 1955 |
| Cleveland | 1955 |
| Lisbon | 1959 |
| Milan | 1964 |
| Montreal | 1966 |
| Rotterdam | 1968 |
| Munich | 1971 |
| Nuremberg | 1972 |
| San Francisco | 1972 |
| Sao Paulo | 1974 |
| Santiago | 1975 |
| Brussels | 1976 |
| Washington DC | 1976 |
| Marseille | 1977 |
| Amsterdam | 1977 |
| Vienna | 1978 |
| Lyon | 1978 |
| Rio de Janeiro | 1979 |
| Atlanta | 1979 |
| Helsinki | 1982 |
| Baltimore | 1983 |
| Caracas | 1983 |
| Miami | 1984 |
| Puerto Alegre | 1985 |
| Recife | 1985 |
| Vancouver | 1985 |
| Belo Horizonte | 1986 |
| Genoa | 1990 |
The unit of analysis here in the subway project. Each of the 85 lines in our spreadsheet has information of a given project. In most cases, these projects are lines. At the start of our research project, we were confronted with the issue of what counts as a separate subway project. Since our ultimate goal is to understand why the costs of building subsurface public transport projects varies so much between countries, we decided that an intra-urban or inter-urban passenger line that runs entirely above ground but which happens to be owned by a company that also runs sub-surface railways would not be classified as a subway project. This point is important because the firms that built and operated New York’s subways subsequently amalgamated with the companies that had been providing surface and elevated railway passenger service within the city since the 1860s. Some of these surface lines were subsequently merged into subway routes. Similarly, an intercity train line that runs underground on its final approaches to a railway terminus such as Grand Central Station would not be classified as a subway.
To illustrate what we mean by a distinct project, let’s focus in for a second on the lines that later became part of the New York’s integrated subway system.
Today, New York City’s subway network consists of 248 miles (399 km). Approximately 40% of this network runs above ground, although all of the network’s 25 routes have at least one substantive portion that is underground. The vast majority of this network was built between 1900, when construction of the first subway began, and 1940, when the network came into public ownership. (Between 1870 and 1873, a subsurface pneumatic passenger railway approximately 300 feet in length operated in Manhattan. We did not examine the costs of constructing this curiosity). Prior to 1940, New York’s subways had been operated by three companies the time the first subway opened, the IRT, Brooklyn–Manhattan Transit Corporation (BMT), which itself the product of a merger, and the municipally-owned and operated Independent Subway System (IND) opened in 1932. Prior to the opening of the first subway line in 1904, New York’s mass transit railway system had consisted of 66 miles of surface and elevated lines. The opening the IRT’s Lexington-Broadway line, which included 12.8 miles of tunnels, increased the total length of the city’s urban rail network to 80.1 miles. The first regularly operated subway in New York City were those built and operated by the Belmont interests under city Contracts 1 and 2. Contracts 3 and 4, which were signed in March 1913 had three parties: the city, the Interborough Rapid Transit Company and the Brooklyn Rapid Transit Company (BRT). Under the terms of the so-called Dual Contract system, the private firms agreed to build new lines and rehabilitate existing lines, including the purely elevated railways built before the advent of the subway system. The Dual System limited competition between the IRT and the BRT systems, permitting both systems to invest with confidence knowing the other system would not build a closely parallel line. The downsides of the Dual Contracts include the lack of a provision for inter-company interoperability: “Incompatible infrastructure permanently prevents the running of through trains between the networks of both companies” (English, 2021, 883) .
The construction of subway lines accelerated after the creation of the Dual System in 1913. By 1930, the network had reached 248.7 miles in length of which approximately 80 miles ran through tunnels and 42 miles were elevated (ran on viaducts). From 1932, the expansion of the network was largely the result of the building activity of the IND, which constructed the Eight Avenue, Crosstown, and other lines (Pushkarev and Zupan, 1980). The total length of the network reached 308 miles, its historic maximum length in 1938. In that year, 136.6 miles of the network were underground. Construction of the network slowed after 1940, notwithstanding several attempts to reinvigorate the system via the creation of new organizational structures, such as the New York City Transit Authority (NYCTA) in 1953 and the regional Metropolitan Transportation Authority created in 1968. In the 1968, New York’s mayor launched a grandiose Program of Action to expand the subway network under which 50 miles (80 km) of new lines were to be constructed. The proposed lines would have connected JFK airport to the city via subway. Due to the financial problems the city experienced in the 1970s, very little of this new network was constructed: to date, on six of the stations and 15 miles (24km) of the track projected in 1968 had been constructed by 2013 (Raskin, 2013).
Sources Cited
In reviewing the primary and secondary sources related to the subways constructed before 1940, we found evidence that these entrepreneurs sometimes deliberately under-estimated the costs of building a given line so as to win a contract that would enrich the investors through the profit-making operating company (Latta, 1975). For this reason, we were sceptical of the claim made in 1909 by IRTCC engineer Arnold J. Bion that it cost $600,000 to $900,000 in contemporary dollars to build a mile of subterranean subway and $1.2 to $1.8m to build a mile of under-river subway (Bion, 1909, p.12). Moreover, those figures did not, according to Bion, include the cost of building the power transmission system within the tunnels, costs that are normally included in other estimates of subway cost construction. So we went searching for better sources of data, which we ultimately found and incorporated into our dataset.
References
ARNOLD, B. J. (1909). The return on the investment in the subway of the Interborough Rapid Transit Company of New York city: submitted to the Public Service Commission for the First district of the state of New York. New York City, Public Service Commission.
Cudahy, B. J. (1995). Under the Sidewalks of New York: The Story of the Greatest Subway System in the World. Fordham Univ Press.
Derrick, P. (2001). Tunneling to the future: the story of the great subway expansion that saved New York. NYU Press.
English, J. (2021). Derailed: The Postwar End of New York City Subway Expansion. Journal of Urban History, 47(4), 832-848.
Eno Center For Transportation (2021). “Five Takeaways From the Transit Capital Costs Database” https://www.enotrans.org
Galviz, C. L. (2019). Cities, railways, modernities: London, Paris, and the nineteenth century. Routledge.
HM Treasury (2010). “Infrastructure Cost Review: An investigation into how to reduce civil engineering costs for major infrastructure projects”
https://www.vox.com/22534714/rail-roads-infrastructure-costs-america
Kirschling, K. M. (2012). An economic analysis of rapid transit in New York, 1870-2010. Kyle Mark Kirschling.
Latta, C. M. (1975). The return on the investment in the Interborough Rapid Transit Company. Columbia University PhD Thesis.
Orton, H. (2013). History of underground power cables. IEEE Electrical Insulation Magazine, 29(4), 52-57.
Pushkarev, B., & Zupan, J. (1980). Urban rail in America: an exploration of criteria for fixed-guideway transit (No. UMTA-NY-06-0061-80-1Final Rpt.).
Raskin, J. B. (2013). The Routes Not Taken: A Trip Through New York City’s Unbuilt Subway System. Fordham Univ Press.
Robbins, M. (1997). London Underground and Moscow Metro. The Journal of Transport History, 18(1), 45-53.
Vox (2021). Why does it cost so much to build things in America? This is why America can’t have nice things. 28 June 2021
